What is Marketing Mix Modelling?
In short – it’s is a technique to measure your marketing efforts. Through marketing mix modelling, we use advanced statistical techniques coupled with a deep understanding of your industry and market to measure the performance of your marketing mix. Our approach is customized to address your specific market, your unique brand, and your business challenges. We provide actionable insights to increase sales, market share, and marketing ROI.
We identify the strengths and weaknesses of your marketing programs and address your key issues with your media mix: traditional media, digital media, social media, price, promotions and other factors.
We examine external influences such as:
– competitive actions (competitors media investments and activities)
– seasonality (time, weather etc.)
– economic conditions (tax changes, GDP, CCI etc.)
to understand how these other factors impact your sales performance. The results of our marketing mix modelling are used to improve performance by improving the effectiveness of marketing and reallocating spending within media types or product lines for increased marketing ROI.
A common Marketing Mix Modelling would consist of the following parts:
1. Setting a hypothesis and the objectives – what do we want to know?
2. Getting the data – which data do we have and how much of it can we get it?
3. Working with the data – what can we extract from the data?
4. Concluding the results – which activities we need to improve?
The starting ground will be setting the hypothesis of what questions need to be answered by the analysis.
For e.g. “I need to sell 20000 products in this year – how much do I need to invest into marketing and media?” or going even more specific “how much money should be invested into specific media channels and which one would have the biggest sales impact?”
From a clearly set goal, we will get the understanding of the scope and scale of the analysis, which is needed to know which data we should have for such work.
Data comes in many shapes and forms, so it’s important at the initial meetings to have as many stakeholders behind the table as possible as not all of the departments have a clear overview of all the data possibilities within the company.
The most often used metric we need to analyse is sales. How and by what is sales influenced by?
To answer the question, we will need to go through the above mentioned variables such as competitive actions, period related influences and economic conditions with as much of it as we have.
The minimum length of a dataset should be 2 years as a period less than a year wouldn’t be able to explain seasonality and other period related changes. Also, the more granular the data the better. Usually sales and economic data come in a monthly form which is sufficient for most analysis but weekly or daily data (dependent on the analysis) is even better.
Anything the competitors are doing with their media investments or activities will be provided by your media agency or the local media-monitoring company. Possible access to all economic and other data (such as weather etc.) will be discussed within the initial meetings.
One example dataset for a car brand:
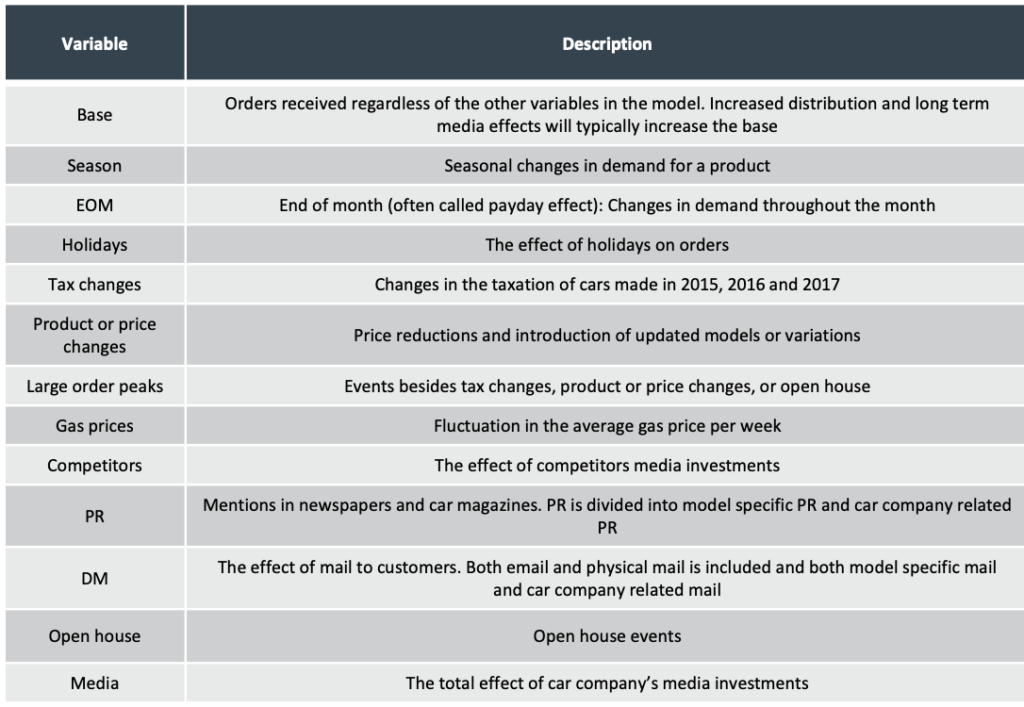
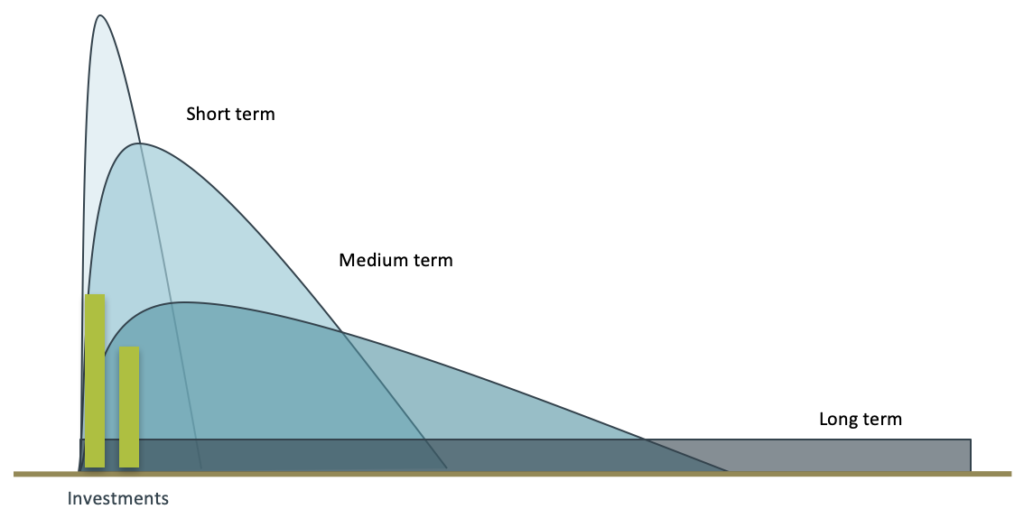
In order to get the full understanding of how media affects orders it is important to divide and estimate media effects according to how they work over time.
Via sales modelling we can directly estimate and quantify the effects of short and medium term investments.
Long term effects of media investments are related to sustaining/growing brand strength and base sales and are estimated through brand tracking variables.
As the sales model is based on historic data only it is however also important to leave room for corrections in relation to upcoming shifts in the market place or for testing new market activities.
Furthermore there should also be room for long term and brand related strategic priorities, depending on the size of the total marketing budget.
It is important to underline, that those activities which have the largest effect short term often also work best long term. As a ground rule we recommend to let the sales model guide 70-80% of the total media-/marketing investment, being fact based tactical activities; 10-20% for strategic focus aimed at growing future profits; and up 10% for marketing innovation.
Findings and recommendations based on the model focuses on optimising profit short and medium term and should therefore act as a significant guide for future activities.
After the datasets are clarified, the analyses we run based upon them will result in a model – taking all of the obtained and observed variables into consideration, which will explain how well the reality matches with our model.
Based upon our data analysis, we create a model graph to replicate different factors in a timeline so that we could create an estimation based on these factors.
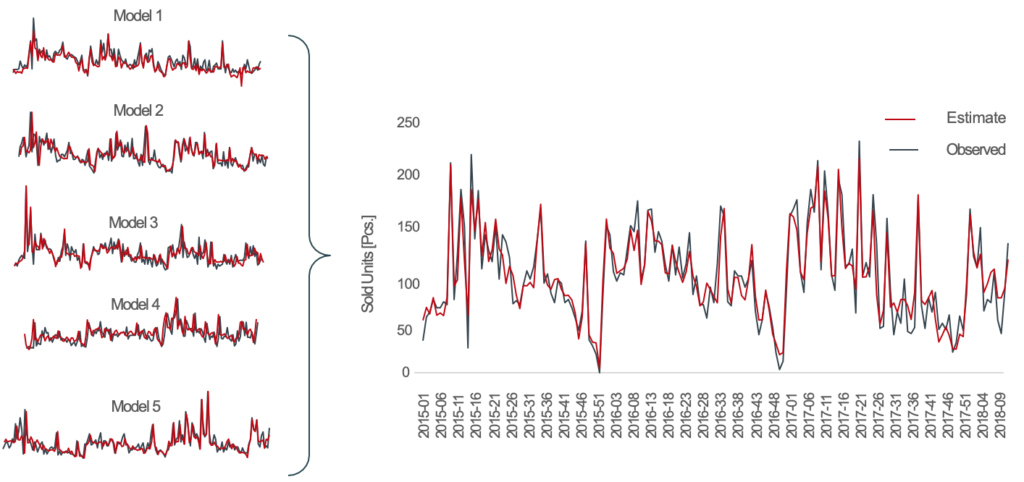
These models will be drilled down into providing in-depth overview of each marketing activity’s effect on the product’s sale. Which will then give an answer on whether the effect on sales is positive or not and is it cost-effective?
(The figures below show the potential gross profit gained by optimising the media allocation for each product. The total budget for each product is kept at the same level as the year before.)
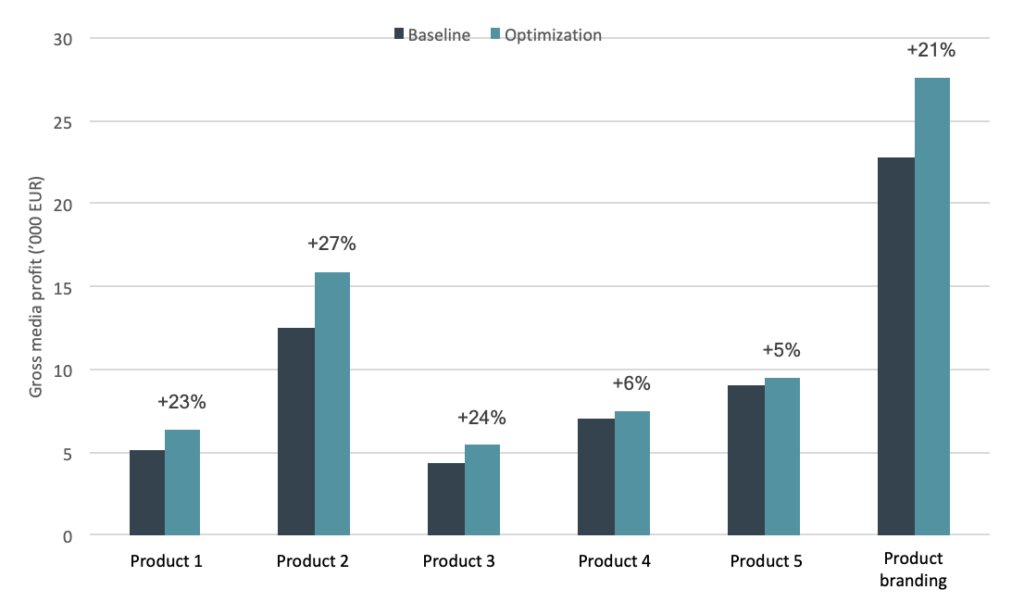
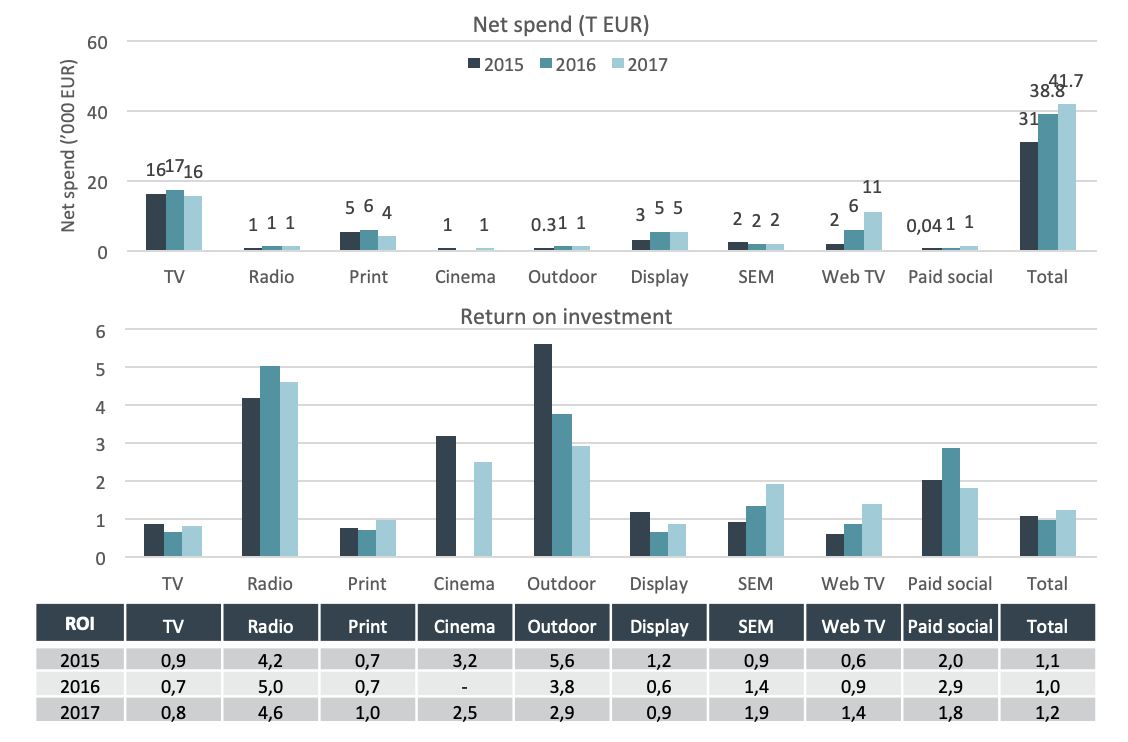
(The figures show the total return on investment for the five products and for the company’s brand communication. The return on investment has been boosted slightly in 2017 by the introduction of a new product as this generates new spillover effects for all communication messages. Increased profit from one product sales and decreased profit from another one’s sales in 2017 also influence the return on investment.)
The results of the analyses will conclude the answers for the questions that were initially set and provide an actionable plan to move forward. The results can also be used to automate digital media planning when used together with multi-touch attribution analysis.
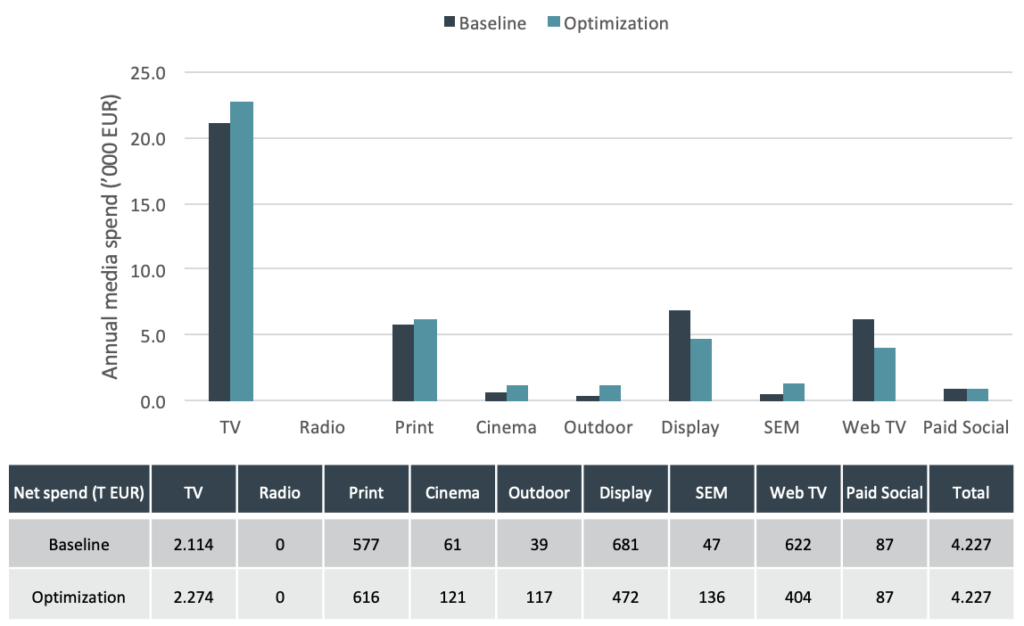
One example of an actionable result is the following graph where we found out that for one particular product, in terms of media investments – TV was over-invested whereas WebTV and Display channels showed more potential than was used. This would be an insight for the future media strategy.
To conclude – Marketing Mix Modelling can and will answer most of your marketing related questions. Whether it’s about budgeting or effects, if there’s enough data to obtain, the actionable results will follow suit. Who wouldn’t want to sleep well knowing that their marketing investments are not just costs but clear sales contributors? If you too want to get the clearer picture of your marketing, do get in contact – info@marcom.ee