A marketing campaign dashboard is a powerful tool for any marketing manager to help achieve their set goals and KPIs. Whether it’s an marketing overview slide to present to your board of directors or just having a real-time overview of all the campaign metrics together with your sales data at all times, gives you and your media partner the agility to drive your media investments ROI.
A similar dashboard can be configured for any kind of need and dataset you might have. Most commonly we have built marketing dashboards that combine datasets like: results from Facebook, Google Ads, Google Analytics, Adform, Kantar/TNS EMOR, weather and sales data from clients themselves. As an extra step, if a customer has an active DMP strategy, the gathered segments and results could also be included.
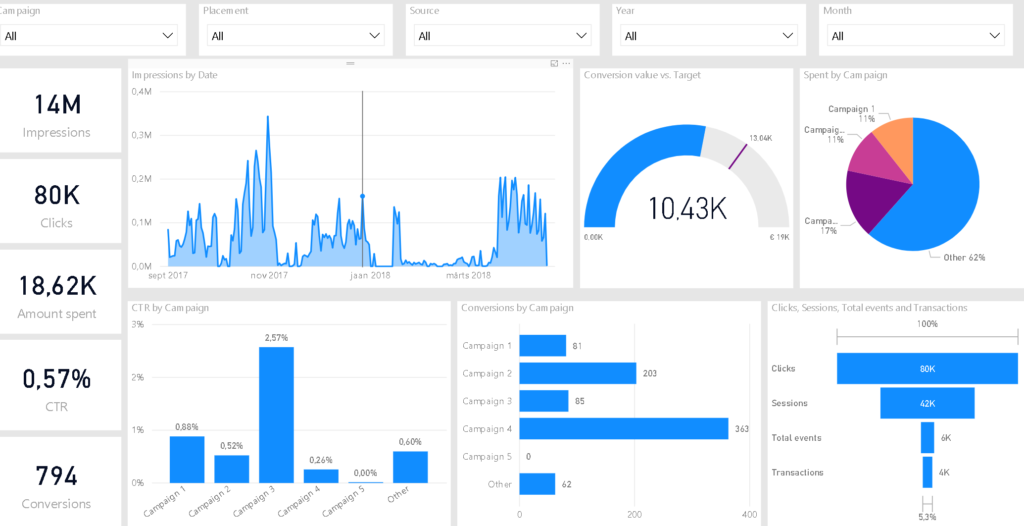
The example below is developed upon a Microsoft PowerBI platform but we do work on Qlik Sense/View and Tableau as well.
Dashboards help to visualise the correlation between marketing activities and sales. Whether it’s sending out email newsletters, investing into media or price adjustments – if the customer has a measured contact point, the path to conversion will be seen. The visualisation has helped many of our clients to understand their activities better than before – allocate media budgets towards more measurable activities and get a better return for their investments.
If you want to know whether a dashboard would benefit you too – do contact us
at info@marcom.ee